Building a GUI for a Program Used in Evolutionary Biology
lvb and what it does
On the basis of DNA evidence (Figure 1), we arrange species in a tree showing the pattern of evolutionary relationships. We usually seek the tree for which the minimum number of mutations must be hypothesised to explain the known DNA sequences. The problem of finding this tree increases in size factorially with the number of species in the study. Because of this, it is almost always necessary to use a heuristic, rather than an exact method.A general-purpose heuristic with good theoretical properties is simulated annealing (Figure 2). This works by analogy with the physical process of annealing. The free program LVB was written to investigate simulated annealing in the search for evolutionary trees.
LVB was written with a very basic interface. All input is read, and all output written, as text files (Figure 1, Figure 3). The program is non-interactive, and the analysis must be ‘programmed’ in advance using, for example, a text editor. This is error-prone and confusing for many users, who are mainly biologists rather than computer scientists.
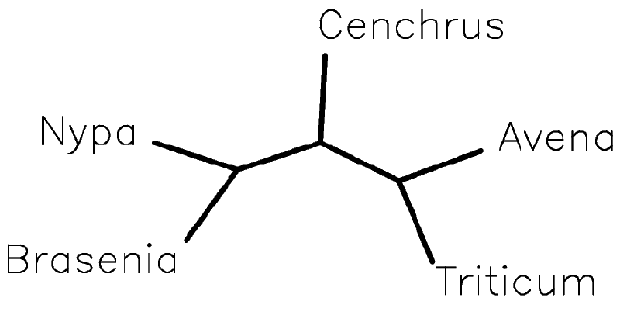
It would be useful for LVB to have a GUI, which should be simple and intuitive. The GUI should allow an analysis to be controlled in every respect. It should show input and output, with graphics where necessary (e.g., Figure 4). There are other features that could be added, for example a progress indicator (cf. Figure 2) and inter-operability with post-processing software. The GUI should run under at least two of the following systems: Win32, MacOS and Unix/X11.
LVB is written in C. It is hoped that the GUI could be written in, for example, Java, with little or no change to the source code of LVB.
This project assumes an interest in biology and problems of optimisation. Specialist knowledge of these fields is not initially required. Help will be available from the author of LVB, Daniel Barker (formerly of Edinburgh University Institute of Cell and Molecular Biology). It is hoped that the GUI will be suitable for future distribution with LVB.
|
Brasenia |
GGATTCAAAGCTGGTGTTAAAGATTACAGATTGACTTATTACACTCCTGATTATGAA |
|
Avena |
GGATTTCAAGCTGGTGTTAAAGATTATAGATTGACTTACTACACCCCGGATTATGAA |
|
Triticum |
GGATTTAAAGCTGGTGTTAAAGATTATAGATTGACTTACTACACCCCAGATTATGAA |
|
Cenchrus |
GGATTTAAAGCTGGTGTTAAGGATTATAGATTGACTTACTACACCCCGGATTATGAA |
|
Nypa |
GGATTTAAAGCTGGTGTTAAAGATTACAGATTGACTTATTACACTCCTGACTATGAA |
Figure 1 -- DNA data as input to LVB. Fragments of the gene rbcL are shown for five plant species. Each row represents the named plant. Each column is a residue (monomer) in the gene and may be one of adenine (A), guanine (G), cytosine (C) or thymine (T).

Figure 2 -- Increase in optimality (decrease in evolutionary steps) during a typical simulated annealing search. Relationship visualised using gnuplot, using data logged to a text file by LVB.
(Brasenia,
Nypa,
(Cenchrus,
(Avena,
Triticum)));
Figure 3 -- Tree showing possible relationships between five plant species, output by LVB as bracketed text.

Figure 4 -- Tree from Figure 3, visualised using drawtree in the PHYLIP package. Avena (oats) and Triticum (wheat) are shown to be more closely related to each other than to Nypa (a palm).
Further Information
The LVB Web page, http://www.icmb.ed.ac.uk/sokal.html
Daniel Barker, sokal@holyrood.ed.ac.uk
Aarts, E. H. L. & Korst, J. 1989. Simulated Annealing and Boltzmann Machines (Chichester: John Wiley)
Fitch, W. M. 1971. Toward defining the course of evolution: minimum change for a specific tree topology. Systematic Zoology 20(4): 406–416
Kirkpatrick, S., Gelatt, C. D. & Vecci, M. P. 1983. Optimization by simulated annealing. Science 220(4598): 671–680
Page, R. D. M. & Holmes, E. C. 1998. Molecular Evolution: A Phylogenetic Approach (Oxford: Blackwell Science)